Market volatility measures the size and speed of price changes and often rises when uncertainty, leverage, or trading imbalances intensify. Learn how it works, why it matters, how to evaluate it, and which risks beginners should understand.
Market volatility is part of the financial landscape, but a short definition does not explain how it operate, why people use it, or where the principal risks sit. This beginner’s guide builds the subject from purpose and mechanics through measurement, evaluation, and practical safeguards.
Rules, taxes, product terms, and available protections vary by jurisdiction and can change over time. Readers should use this explanation as an educational framework, then verify current information in official documents and obtain qualified advice when a decision could materially affect their finances, legal rights, or security.
What Is Market volatility?
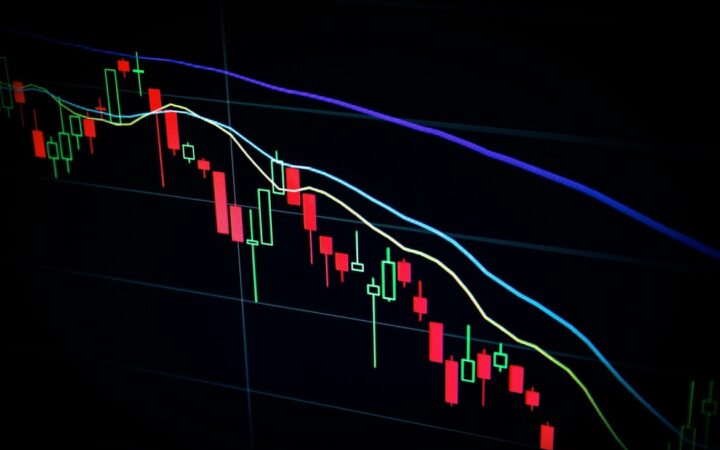
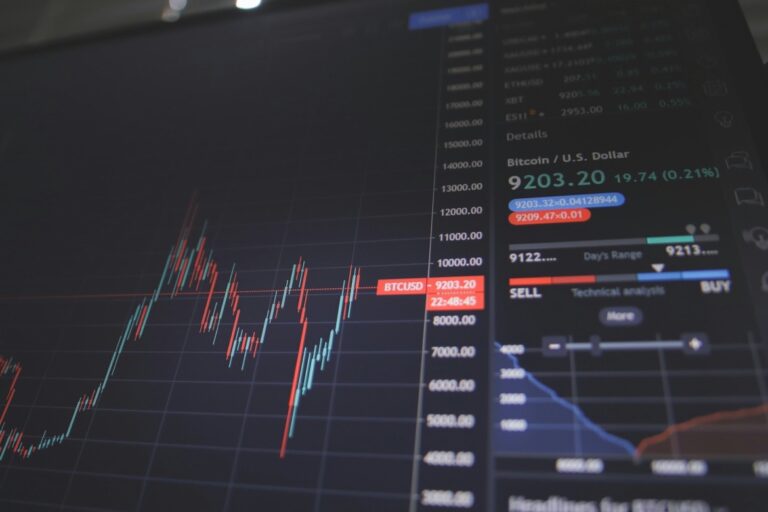
Market volatility measures the size and speed of price changes and often rises when uncertainty, leverage, or trading imbalances intensify.
Why Market volatility Matters
Volatility helps investors compare risk, size positions, price options, set limits, stress portfolios, and understand changing market conditions.
How Market volatility Works
Volatility describes the magnitude and frequency of price changes and can be estimated from past returns or implied by option prices.
In practice, its effects vary across jurisdictions, products, institutions, and market conditions. Comparing several sources and asking who bears each cost or risk prevents a simplified explanation from becoming a false promise.
The Main Elements
Important concepts include implied volatility, historical volatility, drawdowns, risk, options, correlation, market stress. These elements describe different layers of the subject and should not be treated as interchangeable.
In practice, its effects vary across jurisdictions, products, institutions, and market conditions. Comparing several sources and asking who bears each cost or risk prevents a simplified explanation from becoming a false promise.
MarketSpeaker’s glossary provides additional explanations of index-linked bonds and year-over-year comparisons, terms that often appear in data, contracts, research, and financial reporting connected with this subject.
Participants and Institutions
The principal participants include investors, traders, risk managers, market makers, option dealers, exchanges, clearinghouses, and policymakers.
In practice, its effects vary across jurisdictions, products, institutions, and market conditions. Comparing several sources and asking who bears each cost or risk prevents a simplified explanation from becoming a false promise.
Prices, Costs, and Key Measures
Common measures include standard deviation, realized volatility, implied volatility, volatility indexes, drawdown, range, and correlation.
In practice, its effects vary across jurisdictions, products, institutions, and market conditions. Comparing several sources and asking who bears each cost or risk prevents a simplified explanation from becoming a false promise.
Benefits and Practical Uses
Volatility helps investors compare risk, size positions, price options, set limits, stress portfolios, and understand changing market conditions.
In practice, its effects vary across jurisdictions, products, institutions, and market conditions. Comparing several sources and asking who bears each cost or risk prevents a simplified explanation from becoming a false promise.
Risks and Limitations
Volatility can cluster, jump, differ by horizon, understate tail risk, and rise precisely when liquidity and diversification weaken.
In practice, its effects vary across jurisdictions, products, institutions, and market conditions. Comparing several sources and asking who bears each cost or risk prevents a simplified explanation from becoming a false promise.
Connections with Markets and the Economy
Market volatility connects with the wider markets system through prices, funding conditions, confidence, regulation, technology, and the movement of money or information.
In practice, its effects vary across jurisdictions, products, institutions, and market conditions. Comparing several sources and asking who bears each cost or risk prevents a simplified explanation from becoming a false promise.
How to Evaluate Market volatility
Match the measure and time window to the decision, then examine market liquidity, catalysts, positioning, leverage, and possible non-linear outcomes.
Common Beginner Mistakes
The Bottom Line for Beginners
Market volatility is best understood as a system of rights, incentives, processes, measures, and risks rather than a single product or headline number.
Frequently Asked Questions
What is market volatility in simple terms?
Market volatility measures the size and speed of price changes and often rises when uncertainty, leverage, or trading imbalances intensify.
How does market volatility work?
Volatility describes the magnitude and frequency of price changes and can be estimated from past returns or implied by option prices.
Why does market volatility matter?
Volatility helps investors compare risk, size positions, price options, set limits, stress portfolios, and understand changing market conditions.
What are the main risks of market volatility?
Volatility can cluster, jump, differ by horizon, understate tail risk, and rise precisely when liquidity and diversification weaken.
What should beginners check before using market volatility?
Match the measure and time window to the decision, then examine market liquidity, catalysts, positioning, leverage, and possible non-linear outcomes.