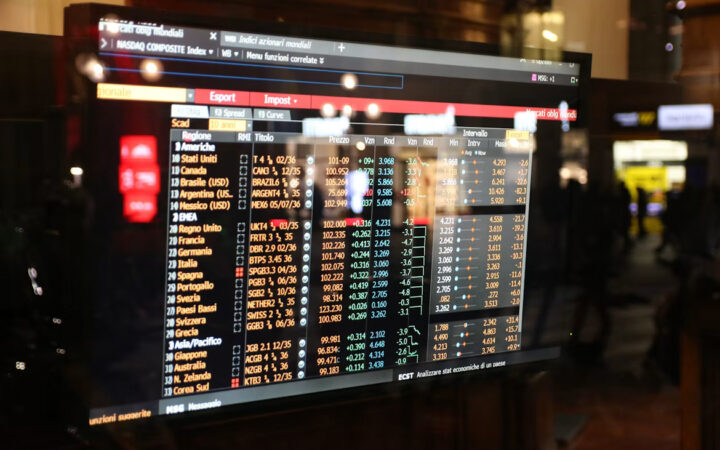
The business cycle describes recurring expansions and contractions in economic activity. Learn its phases, drivers, indicators, market effects, and policy responses.
The business cycle appears frequently in economic news, policy discussions, business planning, and market analysis. The term can look simple at first, yet its meaning depends on definitions, measurement choices, timing, and the mechanism connecting it with the wider economy. A clear framework is therefore more useful than memorizing one headline number.
A business cycle is the broad rise and fall of economic activity around a longer-term growth trend. It is not a fixed calendar cycle. Expansions and contractions vary greatly in length, strength, causes, and effects.
A useful starting point is to separate the definition from its consequences. The concept describes a particular economic relationship; whether that relationship is beneficial or harmful depends on its size, duration, causes, distribution, and the conditions already present when it changes.
The Four Common Cycle Phases
Textbooks describe expansion, peak, contraction, and trough. Expansion brings rising activity, the peak marks a high point, contraction spreads weakness, and the trough marks the transition toward recovery. In real time, those turning points are difficult to identify.
The mechanism is a chain rather than a single event. Households, companies, banks, investors, and governments respond at different speeds, and one group’s adjustment becomes another group’s income, cost, asset, or liability. That is why the final outcome can differ from the first-round effect.
What Happens During Expansion
During expansion, production, income, employment, and spending generally rise. Businesses add capacity and inventories, households feel more confident, and credit often becomes easier to obtain. Excessive optimism can eventually create inflation or financial imbalances.
Measurement requires a stated population, time period, data source, and comparison basis. Readers should check whether a figure is monthly, quarterly, annualized, nominal, real, seasonally adjusted, or revised. Similar-looking percentages can answer very different questions.
For additional context, MarketSpeaker’s glossary explains negative growth and W-shaped recovery, two terms that often appear beside this subject in financial and economic reporting.
What Happens Near a Peak
Near a peak, labor and productive capacity may become stretched. Costs and interest rates can rise, inventories can exceed demand, and profit growth may slow. A peak is recognized only after activity has already begun to weaken.
Several forces normally operate together, which makes one-cause explanations unreliable. Analysts should ask which driver changed first, how broadly the effect spread, whether financing conditions amplified it, and what evidence would disprove the preferred explanation.
In this section, the essential analytical lens is the direction and breadth of activity across output, employment, income, spending, credit, and production. That lens makes it easier to distinguish a broad economic development from a short-lived statistical movement and to connect the data with decisions made in households, boardrooms, markets, and public institutions.
Contraction, Recession, and Trough
A contraction is a decline in broad activity, while recession usually describes a significant and widespread contraction. Falling sales lead firms to cut output and hiring. The trough arrives when deterioration stops, even if conditions still feel weak.
For households, averages can hide large differences. Income, age, location, employment, housing, savings, debt, and consumption patterns determine exposure. The same economic change may help a saver, hurt a borrower, and leave another family almost unaffected.
Personal experience remains valuable but incomplete. A household can observe real pressure before it appears clearly in an average, or feel little change while national data move sharply. Comparing lived experience with a transparent benchmark is more informative than treating either one as automatically decisive.
Why Business Cycles Occur
Cycles can begin with changes in demand, policy, credit, technology, commodity prices, trade, confidence, or supply. Shocks interact with inventories and financial leverage, allowing a small disturbance to spread through employment, income, and spending.
Companies experience the issue through revenue, wages, input costs, inventories, financing, investment, and customer demand. Market power and balance-sheet strength determine how much a firm can absorb, pass on, hedge, or postpone before employment and production change.
Business responses also create second-round effects. A decision to change prices, hiring, inventories, borrowing, or investment affects suppliers and workers, whose responses then influence demand elsewhere. These feedback loops explain why small initial changes sometimes become economy-wide movements.
Leading, Coincident, and Lagging Indicators
Leading indicators aim to turn before the economy, coincident indicators move with it, and lagging indicators confirm a change later. New orders, output, payrolls, claims, and credit measures should be combined because every series sends false signals.
Financial markets look forward, so prices often react before official statistics confirm a turn. Investors compare new information with expectations and then reconsider cash flows, discount rates, risk premiums, liquidity, and policy. A predictable result may produce little movement.
Market prices provide continuous information, but they are not objective forecasts. Positioning, liquidity, regulation, and risk tolerance can move prices alongside economic expectations. Using market signals with the underlying data produces a more balanced interpretation.
How Cycles Affect Households
Expansion usually improves job availability and income, while contraction raises unemployment and financial stress. Household exposure differs according to industry, savings, debt, and job security. A national recovery can therefore feel uneven across regions and families.
Policy works with delays and incomplete information. Officials must distinguish a temporary disturbance from a persistent shift while considering side effects. Action that is too small may lack credibility, while action that is too large can create unnecessary economic and financial damage.
The policy debate should include distribution and time horizon as well as the average effect. A measure that supports activity today may create costs later, while a policy that improves long-term stability can cause near-term strain. There is rarely a tool without trade-offs.
How Cycles Affect Companies and Markets
Cyclical companies are especially sensitive to discretionary spending and investment. Defensive industries may be steadier. Markets often anticipate turning points, so share prices and bond yields can move before official data confirm that the cycle changed.
Connections with other indicators provide a reliability check. Output, employment, prices, credit, income, and expectations should tell a broadly coherent story. When they diverge, the divergence is often the most informative part of the analysis rather than a reason to ignore inconvenient data.
Cross-checking is especially important when the economy is near a turning point. Data arrive at different frequencies and may be revised, so apparent contradictions are normal. A sequence of consistent releases is more convincing than one isolated surprise.
Monetary and Fiscal Responses
Central banks may lower rates or supply liquidity during weakness, while governments can adjust taxes, transfers, and spending. Support can limit damage, but policy arrives with delays and may create inflation or debt trade-offs if it is too large or lasts too long.
A common mistake is to treat a label as a verdict. Economic terms organize evidence; they do not by themselves prove a cause, predict a date, or settle who gains and loses. Good analysis moves from definition to mechanism and then tests the conclusion against several observations.
Why Cycles Are Hard to Forecast
Data are revised, shocks are unpredictable, and economic relationships change. A slowdown does not always become recession, while an apparent recovery may fade. Forecasts are better treated as conditional scenarios than as exact dates for peaks and troughs.
For practical reading, note the latest level, its direction, its rate of change, and its historical range. Then compare the release with expectations and earlier revisions. This routine reduces the temptation to overreact to a single dramatic number or isolated news story.
The Bottom Line for Beginners
The business cycle organizes the economy’s recurring movement between strength and weakness. Follow several indicators, distinguish the level of activity from its rate of change, and remember that turning points become clear only with hindsight.
The most durable lesson is to focus on relationships and trade-offs. A beginner does not need a perfect forecast to reason well; identifying what is measured, what could change it, who is exposed, and which signals would confirm the story is already a strong foundation.
Frequently Asked Questions
What is the business cycle in simple terms?
A business cycle is the broad rise and fall of economic activity around a longer-term growth trend. It is not a fixed calendar cycle. Expansions and contractions vary greatly in length, strength, causes, and effects.
How is the business cycle measured or observed?
During expansion, production, income, employment, and spending generally rise. Businesses add capacity and inventories, households feel more confident, and credit often becomes easier to obtain. Excessive optimism can eventually create inflation or financial imbalances.
What can cause the business cycle to change?
A contraction is a decline in broad activity, while recession usually describes a significant and widespread contraction. Falling sales lead firms to cut output and hiring. The trough arrives when deterioration stops, even if conditions still feel weak.
Why does the business cycle matter to households?
Expansion usually improves job availability and income, while contraction raises unemployment and financial stress. Household exposure differs according to industry, savings, debt, and job security. A national recovery can therefore feel uneven across regions and families.
What is the main lesson for beginners?
The business cycle organizes the economy’s recurring movement between strength and weakness. Follow several indicators, distinguish the level of activity from its rate of change, and remember that turning points become clear only with hindsight.
U.S. Treasury yields have climbed to multi-decade highs, with the 10-year approaching 5.3% and the 30-year topping 5.6% as investors confront persistent inflation, higher rates and mounting federal…