Key Notes
- US producer prices rose 1.3% in September and 6.3% annually, with the monthly increase the largest since March 2022.
- Core PPI excluding food and energy rose 0.7% monthly, while the measure also excluding trade services gained 0.5%.
- Initial jobless claims edged up to 199,000 as renewed price pressure added to the Fed’s October policy debate.
U.S. producer inflation accelerated to 6.3% in September as energy costs surged, while prices rose 1.3% from the previous month in the largest increase since March 2022.
The Bureau of Labor Statistics reported the figures on October 15, adding another inflation challenge after the previous day’s stronger consumer-price reading. August’s headline producer-price increases were revised to 5.6% annually and 0.5% monthly.
Core PPI, excluding food and energy, rose 0.7% during September and 5.0% over the year. Separately, initial unemployment claims edged up to 199,000, leaving the weekly layoffs indicator broadly steady as price pressure intensified.
Producer Prices Rise Much Faster Than Expected
The 6.3% annual increase exceeded the 5.3% consensus in Trading Economics’ calendar. BLS said it was the largest year-over-year rise since December 2022, when producer inflation reached 6.4%.
Monthly forecasts differed by provider. Trading Economics listed 0.5%, while ALM First’s October 14 preview showed 0.6%. The actual 1.3% gain was more than twice either estimate.
The revisions also matter. Comparisons with August should use the updated 0.5% monthly and 5.6% annual readings, rather than the 0.4% and 5.4% initially published last month.
A monthly reading measures the latest change in the index; the annual rate compares prices with a year earlier. Their simultaneous acceleration points to renewed pressure, but the two percentages should not be added together or treated as interchangeable measures.
Energy Drives the Sharpest Goods Increase on Record
Final-demand goods prices jumped 2.6%, the largest monthly increase since that series began in December 2009. More than 80% of the rise came from energy prices, which climbed 10.8%.
Gasoline prices rose 20.3% and accounted for half of the increase in the overall goods index. Diesel, jet fuel and crude petroleum also became more expensive, alongside residential electricity and some food categories.
The pressure extended beyond fuel. Final-demand services rose 0.8%, with nearly half of the increase attributable to a 1.4% rise in trade-service margins. Transportation and warehousing services increased 3.4%.
Trade-service indexes measure changes in the margins wholesalers and retailers receive, rather than simply tracking the shelf price of every product they sell. That helps explain why removing trade services produces a different underlying inflation measure.
Core PPI and the Measure Excluding Trade Both Firm
The food-and-energy-excluding core measure accelerated from August’s 0.2% monthly increase to 0.7%. Its 5.0% annual rise compared with the 4.4% forecast in ALM First’s preview; the monthly forecast was 0.3%.
A separate BLS measure excluding food, energy and trade services rose 0.5% in September, following a 0.3% increase in August. Its annual rate also reached 5.0%, up from 4.8%.
These are distinct series. The 0.7% core reading includes trade-service margins, while the 0.5% measure removes them. Both rose, showing that the headline increase was not solely an energy-price story.
The split is relevant to business earnings. Companies facing higher costs may try to raise prices, accept lower margins or improve efficiency. The PPI report measures prices received by producers; it does not establish that all those increases will pass directly to households.
Jobless Claims Remain Near 199,000
The Labor Department’s weekly claims release showed 199,000 seasonally adjusted initial applications in the week ended October 10, up 1,000 from the prior week’s revised 198,000.
The previous figure was revised upward from 197,000. The four-week moving average rose by 250 to 198,500, providing a smoother measure of recent applications than a single weekly change.
Continuing claims fell by 4,000 to 1.710 million for the week ended October 3. That measure covers a different reporting week and tracks ongoing insured unemployment, rather than new applications alone.
The modest initial-claims increase gives little evidence of an abrupt nationwide surge in layoffs. It does not, by itself, measure hiring, job openings or the unemployment rate, so it should be read alongside the broader labor-market reports.
Another Inflation Test Ahead of the Fed Meeting
The release follows September’s 3.7% consumer inflation reading, as we previously reported. Producer prices describe the seller’s side of transactions, while CPI tracks prices paid by consumers; their different coverage means one is not a direct forecast of the other.
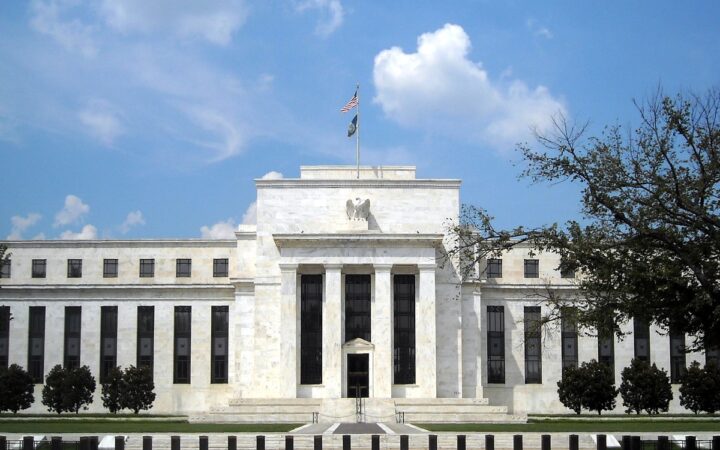
The Federal Reserve’s meeting calendar places the next policy decision on October 28, following a two-day meeting beginning October 27. Thursday’s figures add to the information officials will assess without determining their vote.
Financing costs were already a focus in the global technology selloff we reported before the PPI release. The new inflation data strengthens the case for scrutinizing borrowing costs and company margins, while subsequent policy comments and economic releases will shape the rate outlook.